
 AT A GLANCE
Executive Comparison
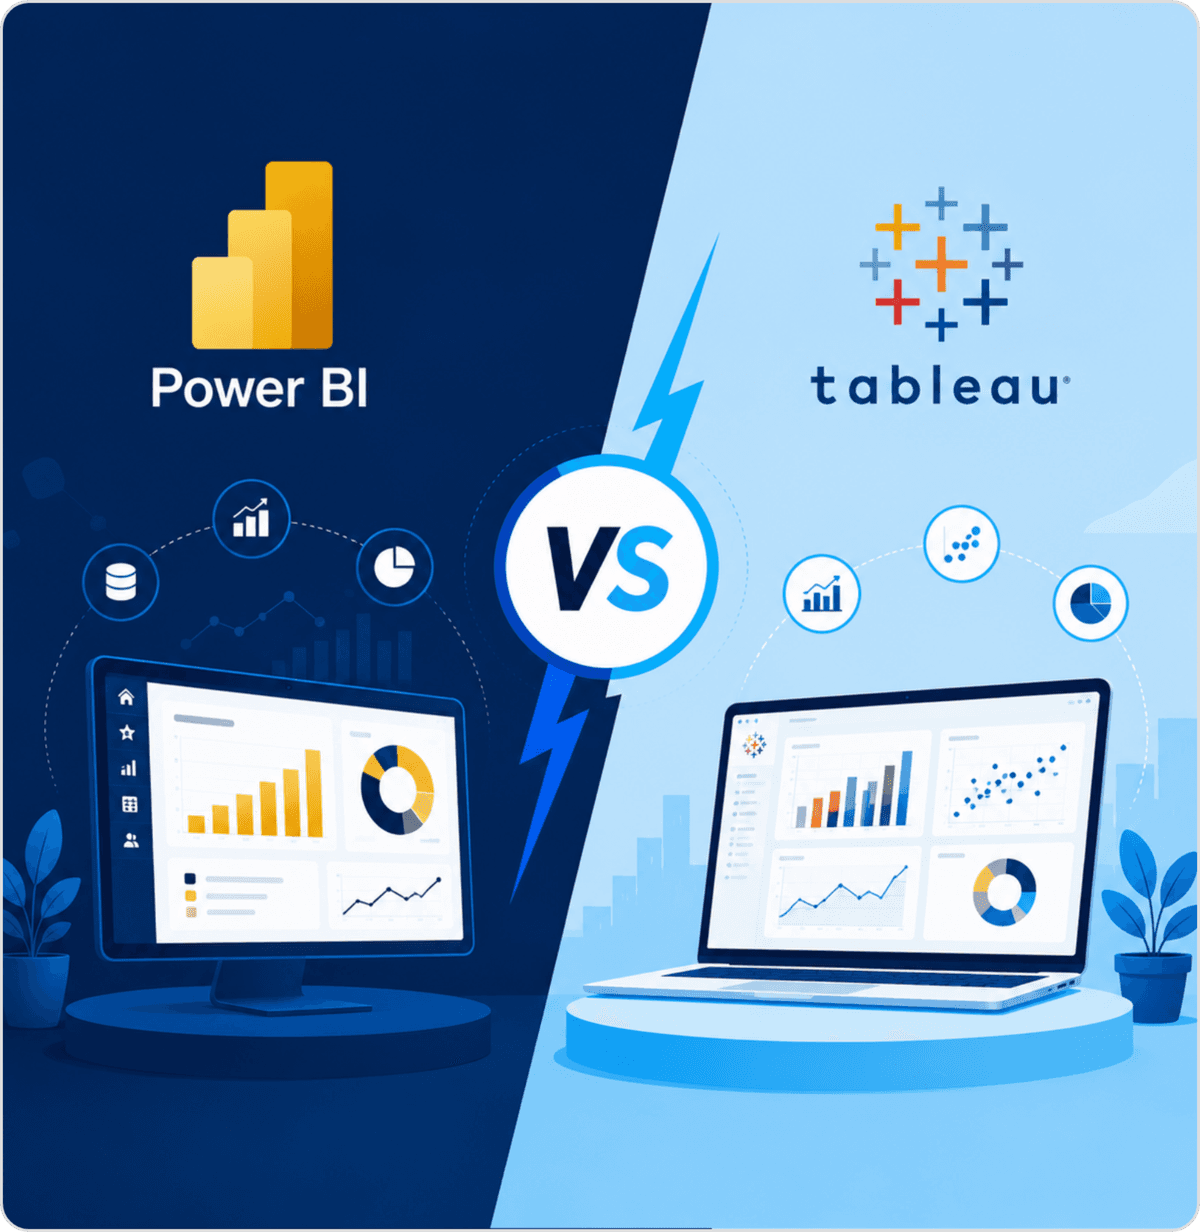
The strongest platform depends on whether your priority is Microsoft ecosystem alignment, advanced visual exploration, governance, cost efficiency, or existing team capability.
| EVALUATION FACTOR | POWER BI | TABLEAU | BEST FIT |
|---|---|---|---|
| Implementation | Fast | Fast | Depends |
| Visualization | Excellent | Very Strong | Tableau |
| Data Modeling | Strong Semantic Model | Strong | Depends |
| Microsoft Ecosystem | Native | Connector Based | 🏆Power BI |
| AI-Assisted Analytics | Copilot + AI Capabilities | Tableau AI / Pulse | Depends |
| Governance | Strong Enterprise Stack | Strong Enterprise Stack | Tie |
| Cost Efficiency | Often Attractive in Microsoft Estates | Premium Analytics Platform | Depends |
| Best Fit | Microsoft-Centered BI | Analytics-First Teams | Depends |
IN-DEPTH ANALYSISDashboards Are Not the Decision
A BI platform should be judged by the full chain from source data to trusted model to insight to action. The prettiest dashboard is not automatically the most valuable one.
Microsoft Fabric Ecosystem
Power BI can sit within a wider Microsoft data architecture spanning Azure, Fabric, Microsoft 365, and enterprise identity.
Strong Semantic Modeling
Semantic models, reusable measures, governance, and centralized business logic can create a more consistent analytical foundation.
Embedded Analytics
Power BI can be embedded across operational and management workflows so insight is closer to the people making decisions.
Microsoft Integration
Organizations already using Microsoft services can reduce integration friction across data, identity, productivity, and reporting.
Advanced Visual Exploration
Tableau is well suited to analysts who need flexible, interactive visual exploration of complex datasets.
Strong Visualization Culture
A mature visualization ecosystem supports sophisticated dashboard design and analytical storytelling.
Broad Connectivity
Tableau supports a wide range of enterprise and third-party data sources.
Mature Analytics Community
A large community of analysts, developers, consultants, and content provides extensive knowledge and implementation patterns.
IMPLEMENTATION MILESTONESDeployment & Time to Value
Illustrative implementation paths. Analytics projects often fail because data quality and KPI definitions are treated as secondary; they should be solved before dashboard volume increases.
Data & KPI Assessment
Identify source systems, KPI definitions, ownership, data quality, reporting latency, and decision requirements.
Model & Dashboard Build
Build semantic models, measures, dashboards, security, and executive reporting views.
Validation & Adoption
Validate numbers against source systems, test permissions, train users, and refine decision workflows.
Governance & Optimization
Monitor refresh performance, adoption, KPI integrity, and reporting usage over time.
Tableau Roadmap
Requirements & Data Review
Define business questions, source systems, metrics, audiences, and visualization requirements.
Data & Dashboard Development
Build data connections, calculations, dashboards, filters, permissions, and analytical views.
Validation & User Testing
Validate calculations, test user journeys, and refine dashboard usability and performance.
Deployment & Governance
Publish governed content, monitor adoption, and continuously improve high-value analytical workflows.
MIGRATION STRATEGYAlready Using Tableau?
Continue with Tableau
If your analytics teams depend on Tableau's visual exploration capabilities and the platform is delivering measurable value, replacement is not automatically justified.
⚠️Evaluate license cost, governance, data architecture, Microsoft integration, adoption, and the cost of migration before changing platforms.
Move to Power BI
A Microsoft-centered organization may consolidate analytics within Power BI when the wider operating stack already includes Microsoft 365, Azure, Fabric, Dynamics, or Power Platform.
✨ Potential Migration Benefits:
- •Align BI with the existing Microsoft data and identity architecture.
- •Create stronger integration between analytics and operational applications.
- •Standardize governance and reporting across the wider Microsoft estate.
FAQFrequently Asked Questions
Both can be implemented quickly for focused use cases. Enterprise rollout speed depends more on data quality, KPI definitions, governance, security, and stakeholder alignment than on the visualization tool alone.
Only when the expected business value exceeds migration cost and disruption. Compare total platform cost, adoption, dashboard inventory, data architecture, governance, and strategic ecosystem fit.
A trusted data model, consistent KPI definitions, ownership, governance, and a clear connection between insight and action. A new dashboard cannot repair unreliable source data.